First-Time Fix Rate: What It Measures and How to Improve It
First-time fix rate shows how well you prepare technicians to succeed, more than how skilled they are. Almost every repeat visit comes from one of four causes.
First-time fix rate is the percentage of jobs resolved on the first visit, with no return trip needed. It is the most quoted metric in field service and one of the most loosely measured. That is a pity, because measured properly it comes closer than anything else to a single indicator of operational health.
What it actually measures
A repeat visit means something went wrong before the technician arrived. By the time a second trip is booked, the failure has already happened, in the diagnosis, the scheduling, the parts or the information handed over.
So the rate tells you how well your organisation prepares a technician to succeed, much more than how skilled the technician is. Teams that use it as a technician scorecard get what you would expect: technicians who close jobs that are not fixed.
Define it before you measure it
Most arguments about the number are really arguments about the definition. Settle these points first.
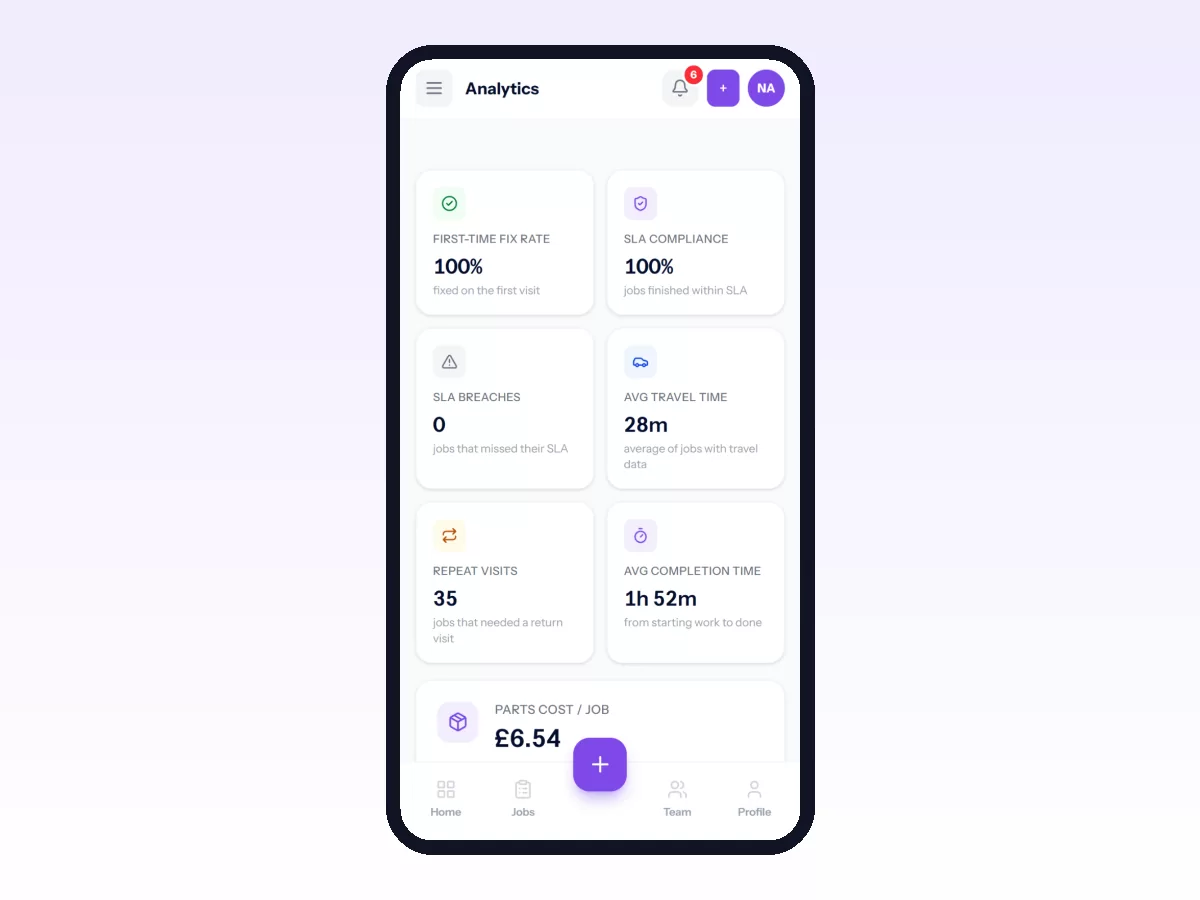
What counts as a return? A second visit for the same fault within a set window; thirty or ninety days are common. A visit for a different fault at the same site is a new job and not a failure.
Do planned multi-visit jobs count? No. If the work was always scoped as two visits, leaving it out is honest. Including it makes your number look worse and tells you nothing.
Does "fixed" mean fixed, or closed? This question matters most. If a technician can close a job by writing "advised customer", your rate measures paperwork.
Who decides? Ideally someone other than the person who did the work. A light review step keeps the definition stable.
Write the definition down. A rate whose definition drifts is worse than having no metric, because it leads to confident conclusions drawn from numbers that cannot be compared.
The four causes of a repeat visit
Nearly every return trip comes from one of these, and each needs a different fix.
1. The wrong part
The technician diagnosed the fault correctly but could not finish because the part was not on the van or in stock.
The fix is to base stock decisions on what your jobs actually use, rather than on what feels prudent. If your system records parts used per job type, you can see which parts turn one visit into two. Keep the top few on the van and the rest in the warehouse.
2. The wrong diagnosis before dispatch
The job was booked as one thing and turned out to be another, so the wrong skills or equipment turned up.
The fix is better intake. The questions asked when the request comes in shape everything after it. A customer portal where the customer picks the equipment and describes the symptom against a structured prompt works better than a phone message passed on twice.
3. The wrong person
The technician was not certified, trained or equipped for what the job turned out to need.
The fix is dispatch that scores skills against job requirements instead of sending whoever is free. See technician dispatch best practices.
4. Missing history
The technician arrived without knowing what happened last time and repeated a diagnosis that had already been ruled out.
The fix is service history attached to the equipment, where it can be found, instead of buried in a list of jobs by date. If a technician can read the asset's history in the van, this cause almost disappears.
How to improve it, in order
Order matters here because the first steps are cheap and the last is expensive.
- Fix the definition. You cannot improve a number that means different things in different weeks.
- Categorise your returns for one month. Tag every repeat visit with which of the four causes it was. It takes minutes per job and tells you more than any dashboard.
- Go after the largest category. The split is almost never even. One cause usually accounts for most returns, and it is often parts.
- Improve intake. Better information when the job is raised improves everything after it at no extra cost.
- Then look at training and stock investment. Both work and both cost real money, so spend it once you know where it should go.
What a good number looks like
Be sceptical of published benchmarks. A team doing planned maintenance on equipment it installed will score far higher than one doing emergency callouts on unfamiliar machines, and neither is better run for it.
Your own trend is the benchmark. A rate that moves from 68% to 74% over two quarters tells you something real. Comparing your rate with an industry average built on a different definition tells you nothing.
The metric it should be read alongside
On its own, first-time fix rate can be gamed by scoping jobs narrowly. Read it alongside:
- repeat visits per customer, which catches problems concentrated in one account;
- average time to resolution, from request to real fix, which a narrow definition of "fixed" will not flatter;
- parts-related delays, which show whether your stock strategy is the constraint.
Together these are hard to game.
Related: Maintenance Technician Productivity: Where the Day Goes