Field Workforce Productivity: Metrics and KPIs
The numbers that show whether a field team is productive, how to calculate them fairly, and how to use them without turning the team against you.
Field productivity is hard to see. Nobody watches the work, jobs vary in size, and travel takes a large part of the day. Managers tend to respond by measuring nothing or measuring everything, and neither helps.
A small set of numbers, reviewed on a regular schedule and read fairly, tells you most of what you need.
Output metrics
- Jobs or visits completed per person per week. This is the headline figure, but it only means something when the jobs are broadly similar, so compare people doing the same kind of work.
- Completion rate: of the jobs assigned, how many were completed rather than cancelled, failed or left open.
- Overdue jobs, meaning work past its due date. A rising count points to too much work, the wrong plan, or a blocker nobody reported.
Quality metrics
- Rework, the jobs that had to be redone. It is the best counterweight to jobs per day, because someone who works fast and creates rework is not productive.
- Problems reported, by category: no access, parts unavailable, customer complaints. These point at causes outside the technician's control about as often as causes inside it.
- First-time fix rate, for service teams. See first-time fix rate.
Time metrics
- Hours worked and overtime, taken from clock-ins rather than timesheets.
- Lateness, measured against each person's own working hours and a grace period.
- On-time rate: jobs done by the time promised.
- Time in each stage, meaning how long jobs sit waiting, travelling or in progress. Long waits usually come from planning.
Using them fairly
- Compare like with like. A technician on installations will never match one on quick repairs for jobs per day.
- Look at trends over weeks. One bad day is noise; four bad weeks is worth a conversation.
- Pair every speed metric with a quality one: jobs completed with rework, on-time rate with problems reported.
- Share the numbers with the team. People improve what they can see, and they trust figures they can check.
- Ask before you draw a conclusion. Most outliers have a reason, such as a difficult site, a missing part or a customer who was not home.
A weekly review in fifteen minutes
- Completed jobs and on-time rate per person, compared with last month.
- Overdue jobs and the reasons for them.
- Problems reported, and which are still unresolved.
- Hours, overtime and lateness, looking for patterns.
- One thing to change next week.
In Movtro
The jobs report in Movtro covers completion rate, on-time rate, overdue jobs, rework, time in each stage, cancellations by reason and problems by category. The workforce report shows each person's jobs completed, on-time rate, hours worked, overtime, times late, and problems reported and resolved.
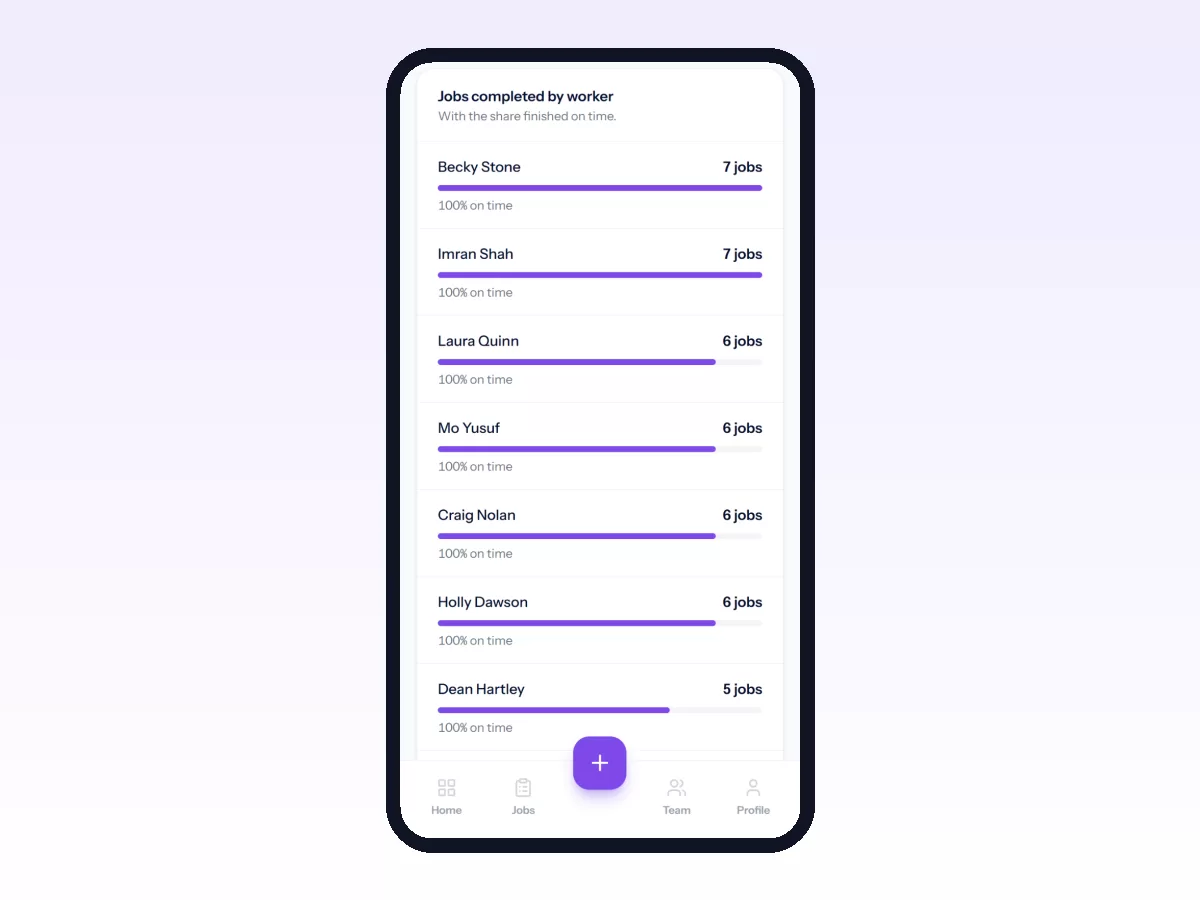
You can filter reports, export them as CSV or PDF, save them, and send them on a schedule, so the weekly review lands in your inbox.
Related reading: field service KPIs, field service reporting and daily field reports managers actually read. Or start free.