Field Service KPIs: Eight Numbers Worth Tracking
First-time fix rate, on-time performance, SLA compliance, utilisation and four more. How to measure each one, and what actually moves it.
Most field service businesses either measure nothing, or measure everything and act on none of it. What works is a short list of numbers you look at every week, each tied to a decision you can make.
The eight below cover the work, the customer and the team. For each one you get what it measures, how to calculate it and what moves it.
1. First-time fix rate
This is the share of jobs resolved on the first visit, with no return trip. Calculate it as jobs fixed on the first visit ÷ all jobs that needed fixing.
It goes up when you send someone with the right skills, the right parts in the van and enough information before they arrive. No other number shows as well how dispatch, stock and diagnosis are working together. See first-time fix rate: what it measures and how to improve it.
2. Repeat visits
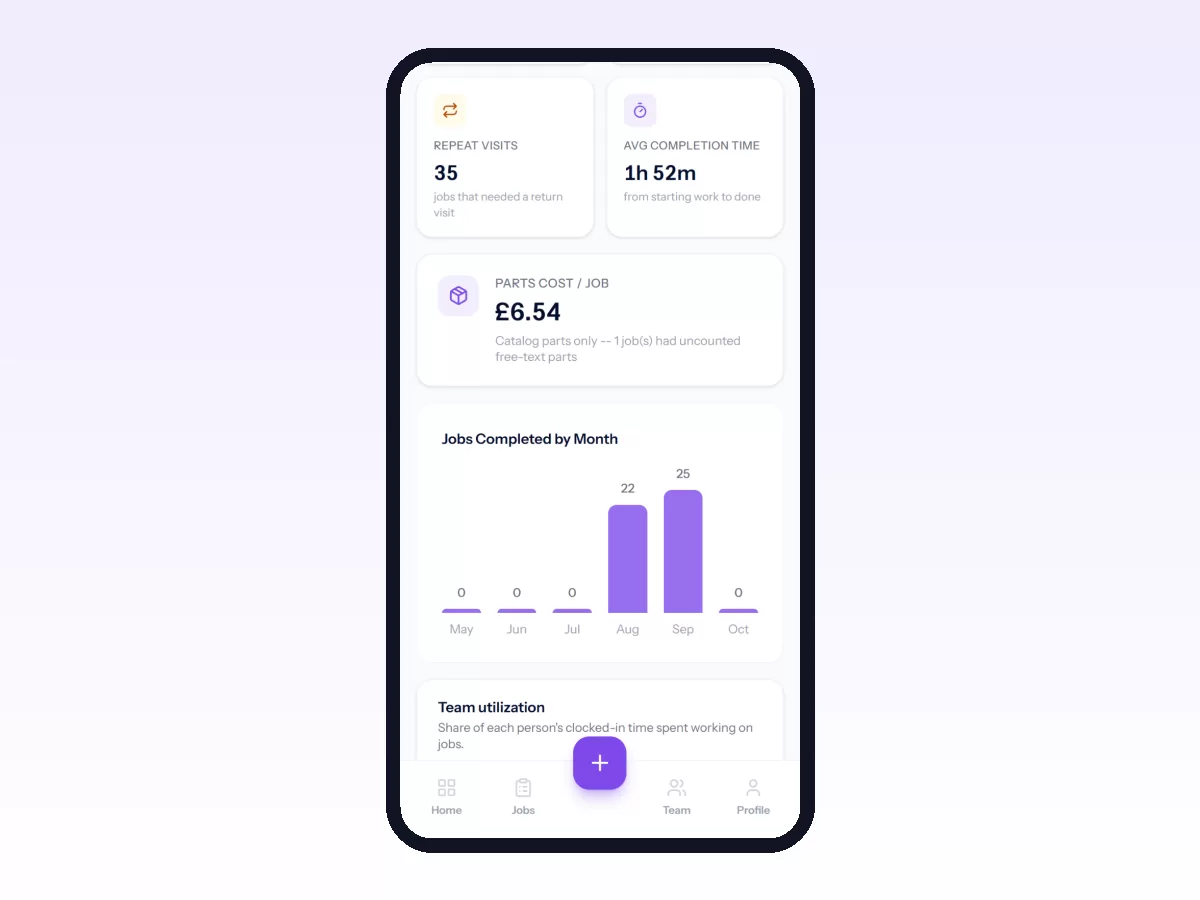
This counts how often the same job, or the same equipment, needs another visit soon after. Count the jobs needing a return visit within a set period, per month.
It is the other side of first-time fix, but worth tracking separately because it points at specific equipment, customers or technicians.
3. On-time performance
This is how often you arrive, or finish, when you said you would: jobs meeting their promised arrival or completion time ÷ jobs with a promise.
Realistic scheduling, allowing for travel time between jobs, and knowing early when a job is at risk all improve it.
4. SLA compliance
This is the same idea made formal: the share of jobs meeting contracted service levels, and how many breaches you had. Calculate jobs within their service level ÷ jobs covered by one. Count breaches separately as well, because a single breach on a big contract matters more than the percentage suggests.
It improves when you prioritise by the promise rather than by who shouts loudest.
5. Technician utilisation
This is how much of a technician's working time goes on jobs: time on jobs ÷ time clocked in.
Routing, scheduling and admin all move it. Very high utilisation is not always good, since a team at full stretch has no room for urgent work. Aim for a range rather than a maximum.
6. Time to complete
This is how long jobs take from start to finish, by job type. Track the average and the spread of time from starting to completing, per job type.
Preparation, parts and experience move it. The spread matters as much as the average. A job type that sometimes takes one hour and sometimes five will cause scheduling problems sooner or later.
7. Backlog
Backlog is open work nobody is doing yet, and how old it is. Count the open, unscheduled or unassigned jobs and note the age of the oldest.
It depends on capacity against demand. A backlog that grows steadily is the earliest sign you need another technician.
8. Cost per job
This is what a job costs you, at minimum in parts and ideally in labour too: parts used at cost, plus time on the job times a labour rate.
First-time fix moves it (return visits double the cost), and so do stock control and pricing.
How to use them
- Pick three to start. First-time fix, on-time performance and backlog cover most businesses.
- Look weekly and act monthly. Weekly numbers catch problems; monthly trends justify decisions.
- Break them down, because a team average hides the technician, job type or customer driving it.
- Never judge a person on one number alone. A technician with a low first-time fix rate may be getting the hardest jobs.
In Movtro
Movtro's analytics and reports calculate first-time fix rate and repeat visits, and on-time performance (arrival within your allowance of the scheduled time, or completion where no arrival was recorded) along with breaches of that allowance. They also give technician utilisation from time on jobs against time clocked in, average travel and completion times, and job cost from parts used. The allowance is one setting for your whole organisation; Movtro does not yet hold different targets per priority or per contract. Reports can be filtered, exported and scheduled.
Getting the data right comes first: see work order management and first-time fix rate, or start free.
Related: SLA Management in Field Service · Equipment and Asset Service History · Field Service Reporting: Reports People Actually Use · Field Workforce Productivity: Metrics and KPIs · How to Build, Save and Schedule Reports